Data visualization and sonification
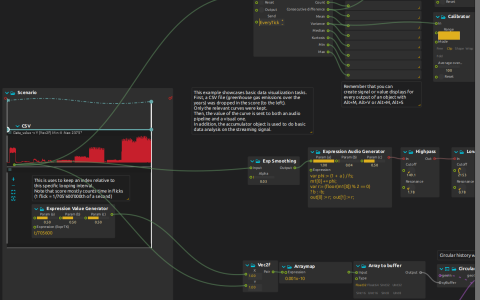
Send an imported data curve to statistics displays, a native GPU history plot and an audio synthesizer.
Open the archive
Open the ZIP directly in score. The archive contains the score, not the source greenhouse-gas CSV: the selected Data_value column has already been imported as an Automation with 6369 segments. You do not need the original CSV to play this curve.
Use a compute-capable graphics backend and Airwindows for TapeDelay2. The embedded compute processes retain library origins under packages/score-csf-testers/shaderlib/: CircularHistory, Deform, AddColor and PointsToSprites. Their code is saved in the document; those paths identify their presets, not an included media directory.
Follow the three outputs
Start playback. Inside the looping CSV scenario, Data_value supplies the Y coordinate of Vec2f, while an Expression Value Generator (t/705600) supplies its time index. Arraymap scales the pair with 0.001x-10; Array to buffer uploads Float32 data. CircularHistory stores the points, Deform returns geometry through a delayed feedback cable, and AddColor → PointsToSprites → SphereSplat renders the history to Window:/. This uses native compute and rendering processes, not Qt Quick 3D. Keep the delayed feedback connection when changing the history graph.
The same curve enters Accumulator, whose sum, count, difference, mean, variance, median, kurtosis, minimum and maximum are individually displayed. Two Calibrators map variance and consecutive difference to a clipped 0–1 range over a 100-sample window, driving delay parameters and color saturation.
For sonification, Exp Smoothing drives the expression oscillator’s Param (a). Its code advances a phase accumulator and emits alternating ±b values to both audio channels. Highpass, Lowpass and TapeDelay2 feed audio:/out/main. Begin quietly; then change smoothing alpha (saved at 0.027), sprite size (0.235), or the imported curve to hear and see different aspects of the data.