Research, sonification and biosignals
Receive data from lab hardware and sensors, play datasets as sound, light or images, record and replay sessions, and build experiments and biofeedback pieces on a timeline. Free and open-source, developed with research labs.
Free and open-source (GPLv3) · Windows, macOS, Linux, Raspberry Pi and web browser
ossia score was born in research labs (project history) and is still developed with them. It connects scientific hardware and datasets to sound, video and light, for experiments, sonification and art made with physiological data.
What you can do
- Lab hardware: Lab Streaming Layer (LSL) for EEG and other physiological devices, CAN bus with DBC databases, serial ports, Bluetooth LE sensors, and anything speaking OSC or MQTT (LSL, CAN, serial).
- Datasets: open HDF5 and CSV files, including large columns, and play them as curves, arrays or textures (HDF5, data processing).
- Sonification and visualisation: map data to synthesis, spatial sound, shaders, 3D or DMX lights, and plot signals while they arrive (data visualisation, Teleplot, signal display).
- Biosignals and biofeedback: heart rate and other physiological signals drive sound, video and light, with smoothing, filtering and statistics (accumulator, value filter).
- Record and replay sessions: record any device to CSV, replay it later, and record audio next to it (recording, CSV recorder).
- Scripted protocols: write the experiment as a timeline with conditions, and automate it with the JavaScript API (scripting API).
- Extend it: add your own C++ objects, expose your own software’s parameters with libossia, and build custom render pipelines for graphics research (plug-ins).
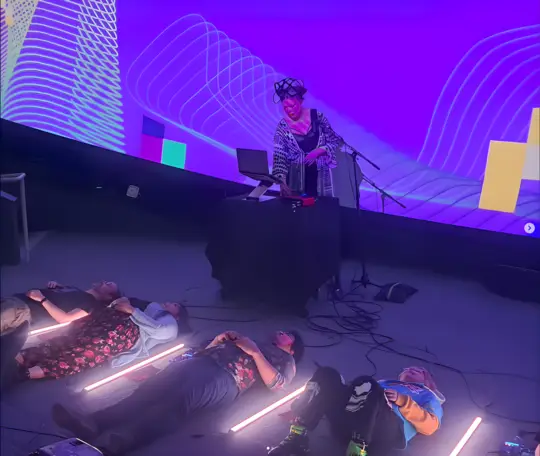
BioSynth light show, Erin Gee: an LED and DMX light show driven by biosignals, run by ossia score headless on a Raspberry Pi.
Research needs, and how ossia score answers them
| What you need | How ossia score does it |
|---|---|
| Getting data from lab hardware in real time | LSL, CAN, serial, Bluetooth LE, OSC and MQTT devices. |
| Hearing or seeing a dataset | HDF5 and CSV files played as curves, arrays or textures, mapped to sound, image and light. |
| Repeating a session exactly | Record devices to CSV and replay them, with the protocol written as a timeline. |
| Software that reviewers and other labs can use | Free, open-source (GPLv3), on Windows, macOS and Linux, with project files that open everywhere. |
| Adding your own algorithm | JavaScript, Faust, shaders and C++ extensions, or libossia in your own program. |
See the gallery for works using physiological data, such as VIBH2O / VIB.E-MOTION by Fheel Concepts, a participatory circus performance driven by the audience’s heart rates.
Free and open-source (GPLv3) · Windows, macOS, Linux, Raspberry Pi and web browser